2015 Utah Seat Belt Survey

Since 1986, the Utah Department of Public Safety’s Highway Safety Office has conducted an annual seat belt observational study to determine the percentage of motorists who buckle up. This study has been the cornerstone for developing, implementing and evaluating occupant protection programs in the state. The first study revealed that only 18% of Utah motorists use seat belts. For nearly three decades, safety advocates have worked to increase the use of this life-saving device by implementing a multi-faceted and comprehensive program. As a result, seat belt use has climbed and lives have been saved.
Executive Summary and Results
The National Highway Traffic Safety Administration (NHTSA) requires state’s to conduct observational surveys annually to determine the level of seat belt use. The 17 counties selected for observation in Utah were: Box Elder, Cache, Carbon, Davis, Grand, Iron, Millard, Salt Lake, San Juan, Sanpete, Sevier, Summit, Tooele, Uintah, Utah, Washington, and Weber.
 The study was conducted June 1-13 during which a total of 25,204 vehicle occupants, including 19,387 drivers and 5,817 outboard passengers, were observed. Forty-one percent (41%) of the observed vehicles were cars, 26% sport utility vehicles (SUV), 25% pickup trucks, and 8% were vans.
The seat belt use rate among motor vehicle occupants was 87.2% in 2015, which demonstrates an increase of 3.8 percentage points from the 2014 rate of 83.4%. The significant increase in seat belt use can be contributed to the strong education efforts by traffic safety partners across the state coupled with enforcement, as well as implementation of a primary seat belt law on May 12, 2015.
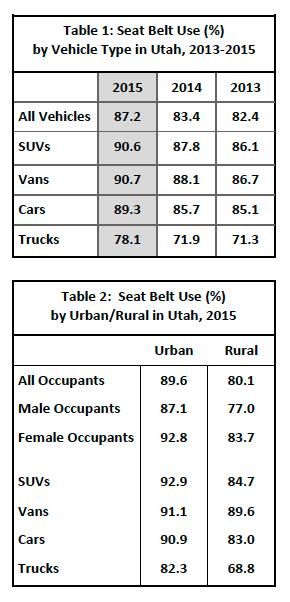
Seat belt usage varied by the type vehicle (Table 1) and type of roadway. More people used seat belts while traveling on highways (91%) when compared to arterial roadways (84.8%) and local roads (80.3%). The study found little difference in seat belt usage among drivers (87.3%) and front seat passengers (86.8%).
Urban counties (Cache, Davis, Salt Lake, Utah, Washington, and Weber) were analyzed separately from rural. The seat belt usage rate for urban areas was 89.6% and 80.1% for rural counties. Table 2 shows that use rates were higher in urban counties in all categories.
The study found that female occupants buckled up more often (90.4%) than their male counterparts (84.6%) and this is true for both urban and rural areas. In urban counties, the use rate among females was found to be 92.8%, whereas the rate among males was 87.1%. In rural counties 81.9% of females were using seat belts but only 74.6% of males buckled up (Table 2).
According to federal guidelines, the reliability of the survey results should be within the 95 percent confidence interval. The standard error was determined to be 0.82%, well within a standard error of 2.5 percent as required by NHTSA guidelines.
Regional Differences and Conclusions
Survey results reflect restraint use by the driver and front seat outboard passenger in a probability sample of vehicles drawn from the counties with the greatest motor vehicle fatality rates in Utah. The seat belt usage rates for occupants are very different from county to county, especially when comparing urban and rural areas of the state.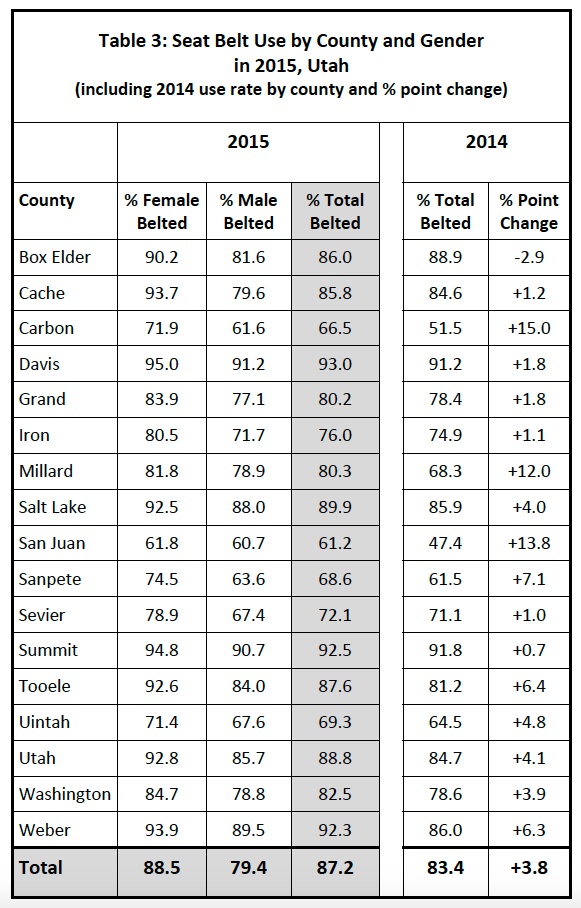
Table 3 presents the seat belt usage rates by county and gender for 2015. It also provides the 2014 rates and percentage change for each county. The table shows Davis, Summit, Weber and Salt Lake counties had the highest usage rate and the rural counties of Carbon, Sanpete, and Uintah had the lowest. In addition, female occupants had a significantly higher usage rate than male occupants in every county surveyed.
In 2015, van occupants, females, highway motorists, and urban residents had the highest seat belt use rates. While truck occupants, males, motorists on local roads, and rural residents had the lowest usage rates. Counties with the highest use rates include Davis (93%), Summit (92.5%), Weber (92.3%), Salt Lake (89.9%) and Utah (88.8%). Counties with the lowest use rates include San Juan (61.2%), Carbon (66.5%), Sanpete (68.6%).
One of the most significant changes in seat belt usage was found among rural motorists which increased 3.7% from the previous year. When examining county data, the largest increases in usage were seen in Carbon (+15.0%), San Juan (+13.8%) and Millard (+12.0%) as shown in Table 3. Seat belt use rates increased .6% from 2012-2013, 1.2% from 2013-2014, and 4.6% from 2014-2015 demonstrating that education, enforcement and policy change contributed to the significant increase in seat belt usage.
Background
In April 2011, NHTSA issued new Uniform Criteria for State Observational Surveys of Seatbelt Use. Utah’s new survey design was accepted as fully compliant with the Uniform Criteria and was used for the implementation of the state’s seat belt surveys beginning in 2012. The most dramatic change in the survey design was the inclusion of 11 rural counties in the study. Prior to 2012, the study only surveyed the six most urban counties in the state. Due to the changes in methodology, the results should not be compared to previous statewide seat belt use surveys and marks a new benchmark for the state.
Survey Design and Methodology
According to survey criteria, each state must study seat belt use within a geographic area that accounts for at least 85 percent of the passenger vehicle crash-related fatalities according to the Fatality Analysis Reporting System (FARS) data averages for the period of 2008 to 2010. Of Utah’s 29 counties, 17 were selected to be included in this study. Road segments by functional classification (Interstate/Primary, Arterial/Secondary, and Local) were randomly selected using a combination of the Utah Department of Transportation roadway file and the 2010 TIGER data developed by the U.S. Census Bureau. All passenger vehicles with a gross vehicle weight up to 10,000 pounds were included in the survey. A total of 170 sites were selected for the study, which took place for a two-week period in June 2015. In each of the 17 counties, 10 sites were surveyed by trained observers who documented belt use and gender among the driver and outboard front seat passenger for a period of 45 minutes at each location.
Report prepared by the Highway Safety Office – for a copy of the complete survey design and methodology contact the Highway Safety Office.
If you found this news entry interesting, please consider sharing it through your social network.