Crash Data and Statistics
Utah Crash Data Portal
Access Utah crash data from 2010 to the most recent data loaded in the application. Note: All previous individual dashboards have been discontinued and merged into this single portal.
How to Use the Data Portal
Select a topic below to watch a quick tutorial on how to navigate the portal, use filters, and download records. Click any image to enlarge it.
Person Summary Tab
Review demographics for people associated with the filtered crashes, viewing injury type, gender, and age-group charts.
↑ Back to TopClassifications Tab
Render specific yes/no safety indicators (such as DUI or distracted driving) to see yearly crashes stacked by severity.
↑ Back to TopMap Shape Filters
Learn how to navigate the interactive Utah map and draw geographic shapes to use as custom spatial filters.
↑ Back to TopHeader Tools
Learn how to open the dictionary, create a shareable view link, access help, filter sidebars, create sidebar filters, and collapse the sidebar for more chart room.
↑ Back to Top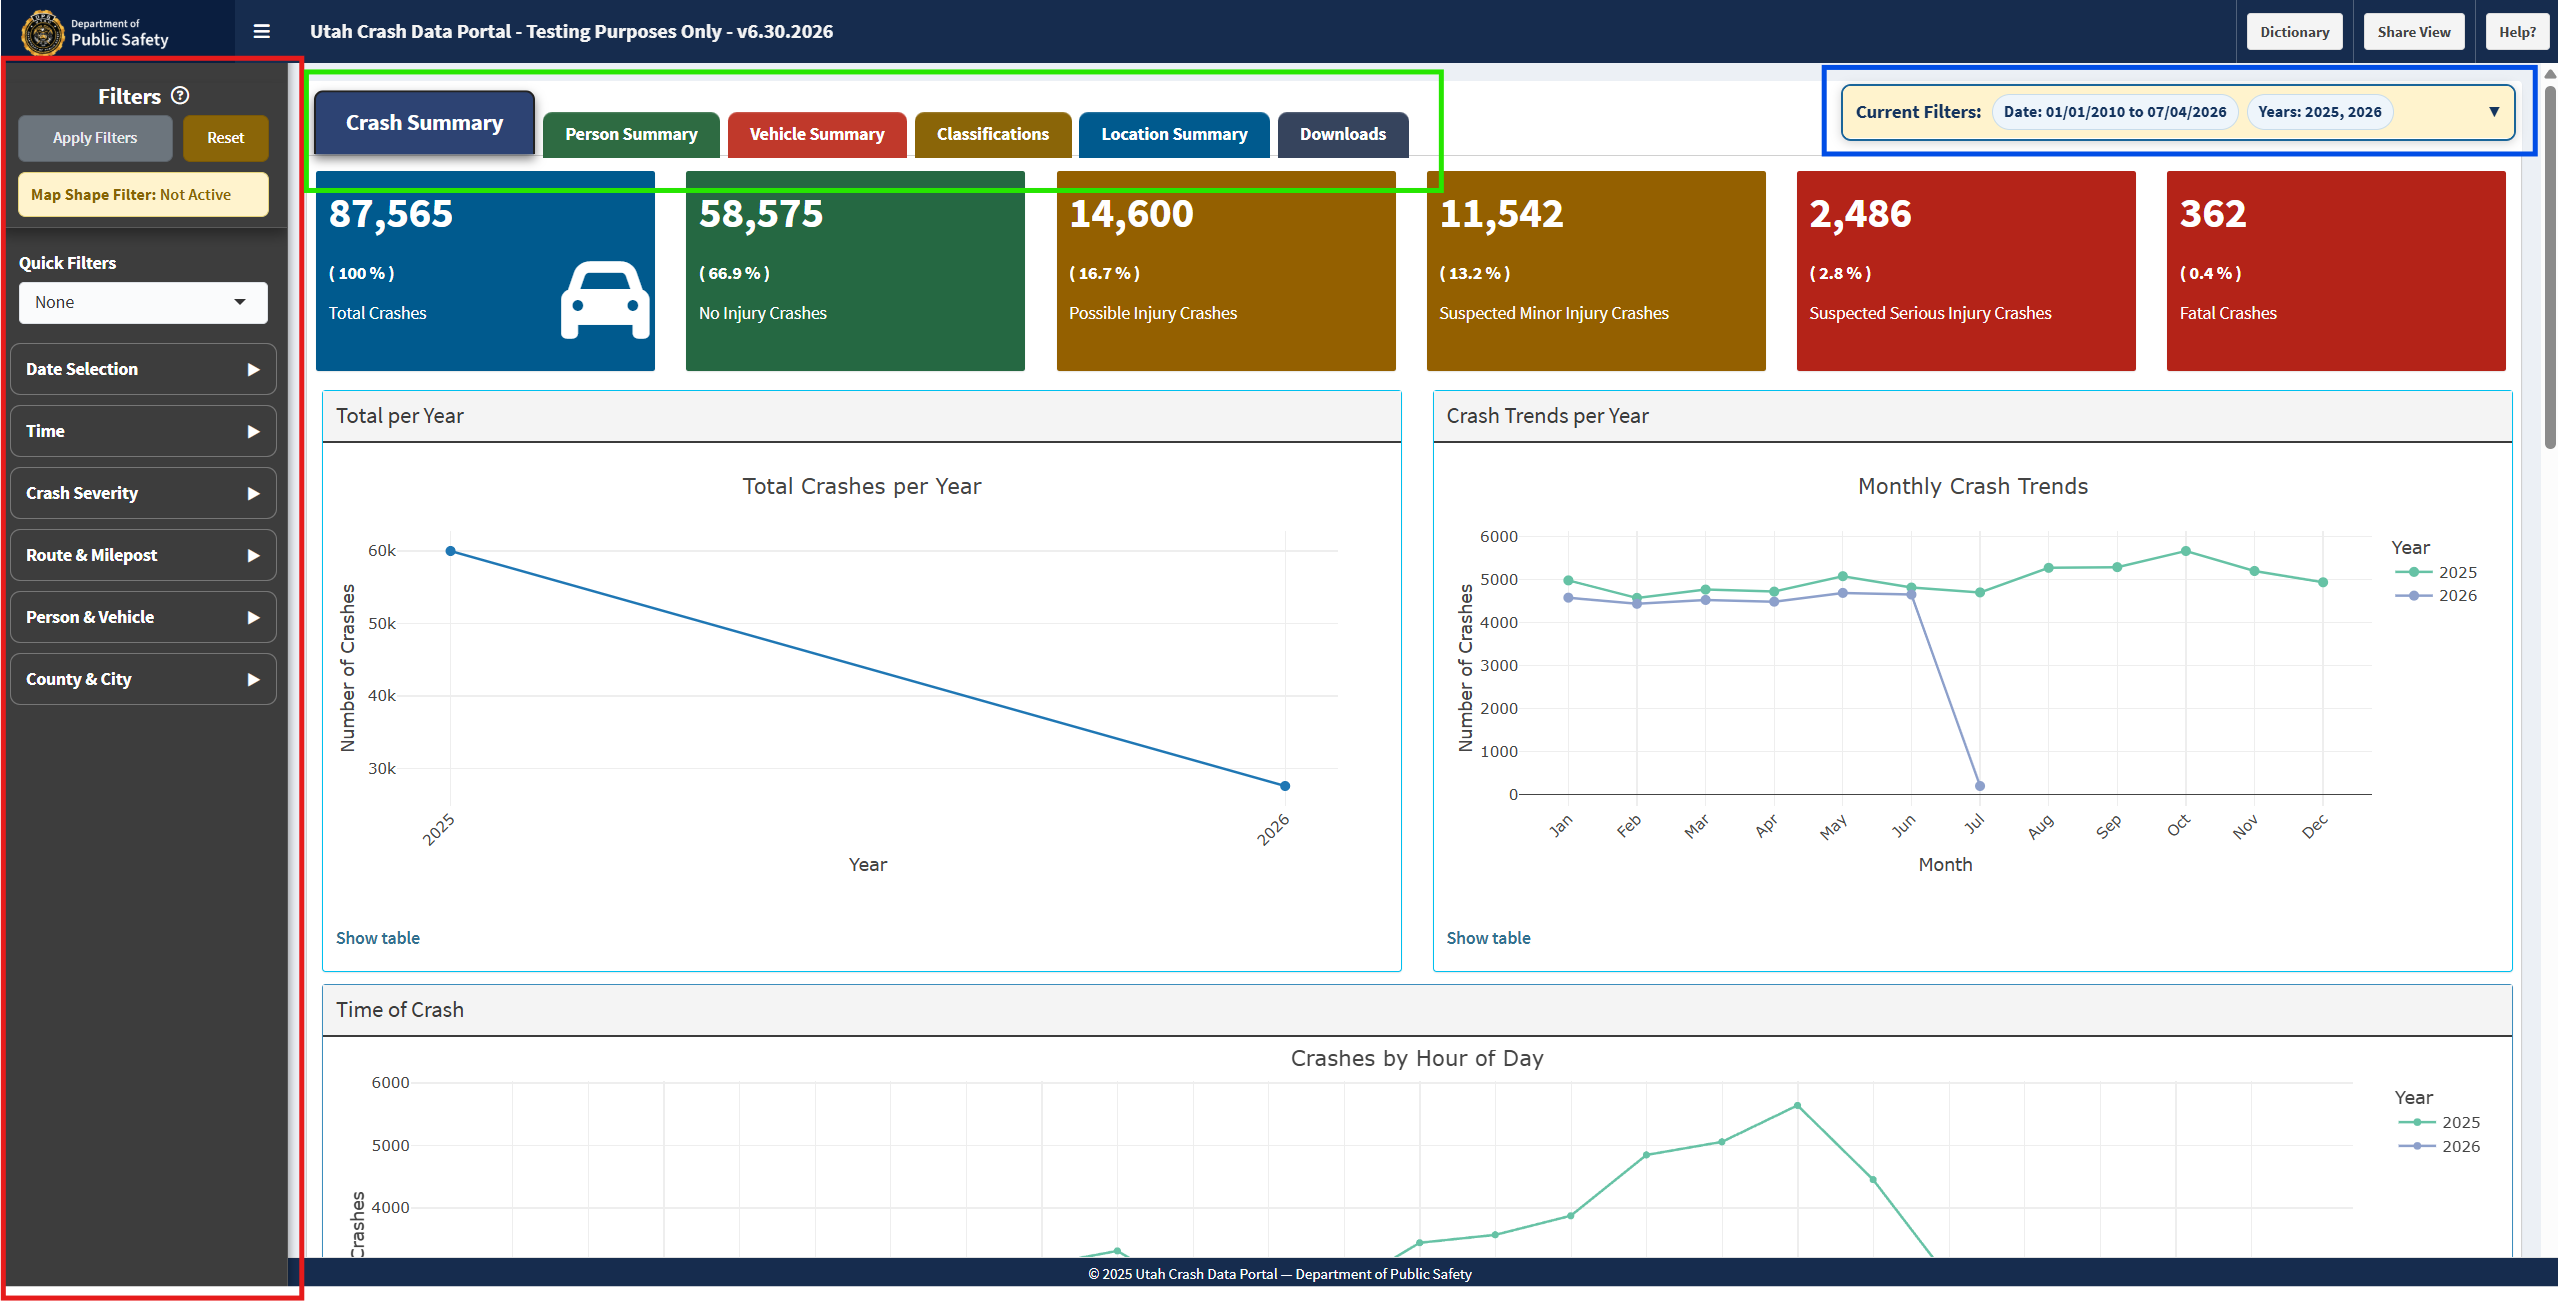
Current Filters Bar
Verify the exact state behind your charts, maps, and downloads by reviewing the active filters applied to your dashboard.
↑ Back to Top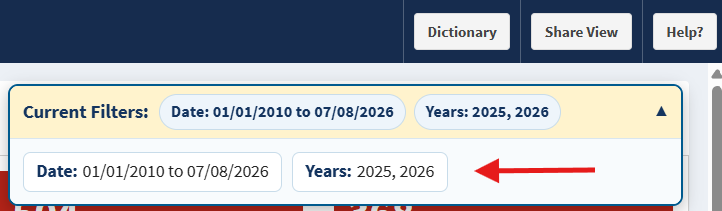
Crash Summary Tab
Explore the main overview of your filtered crash set, including total crashes per year, crashes by hour of day, and roadway contributing circumstances.
↑ Back to Top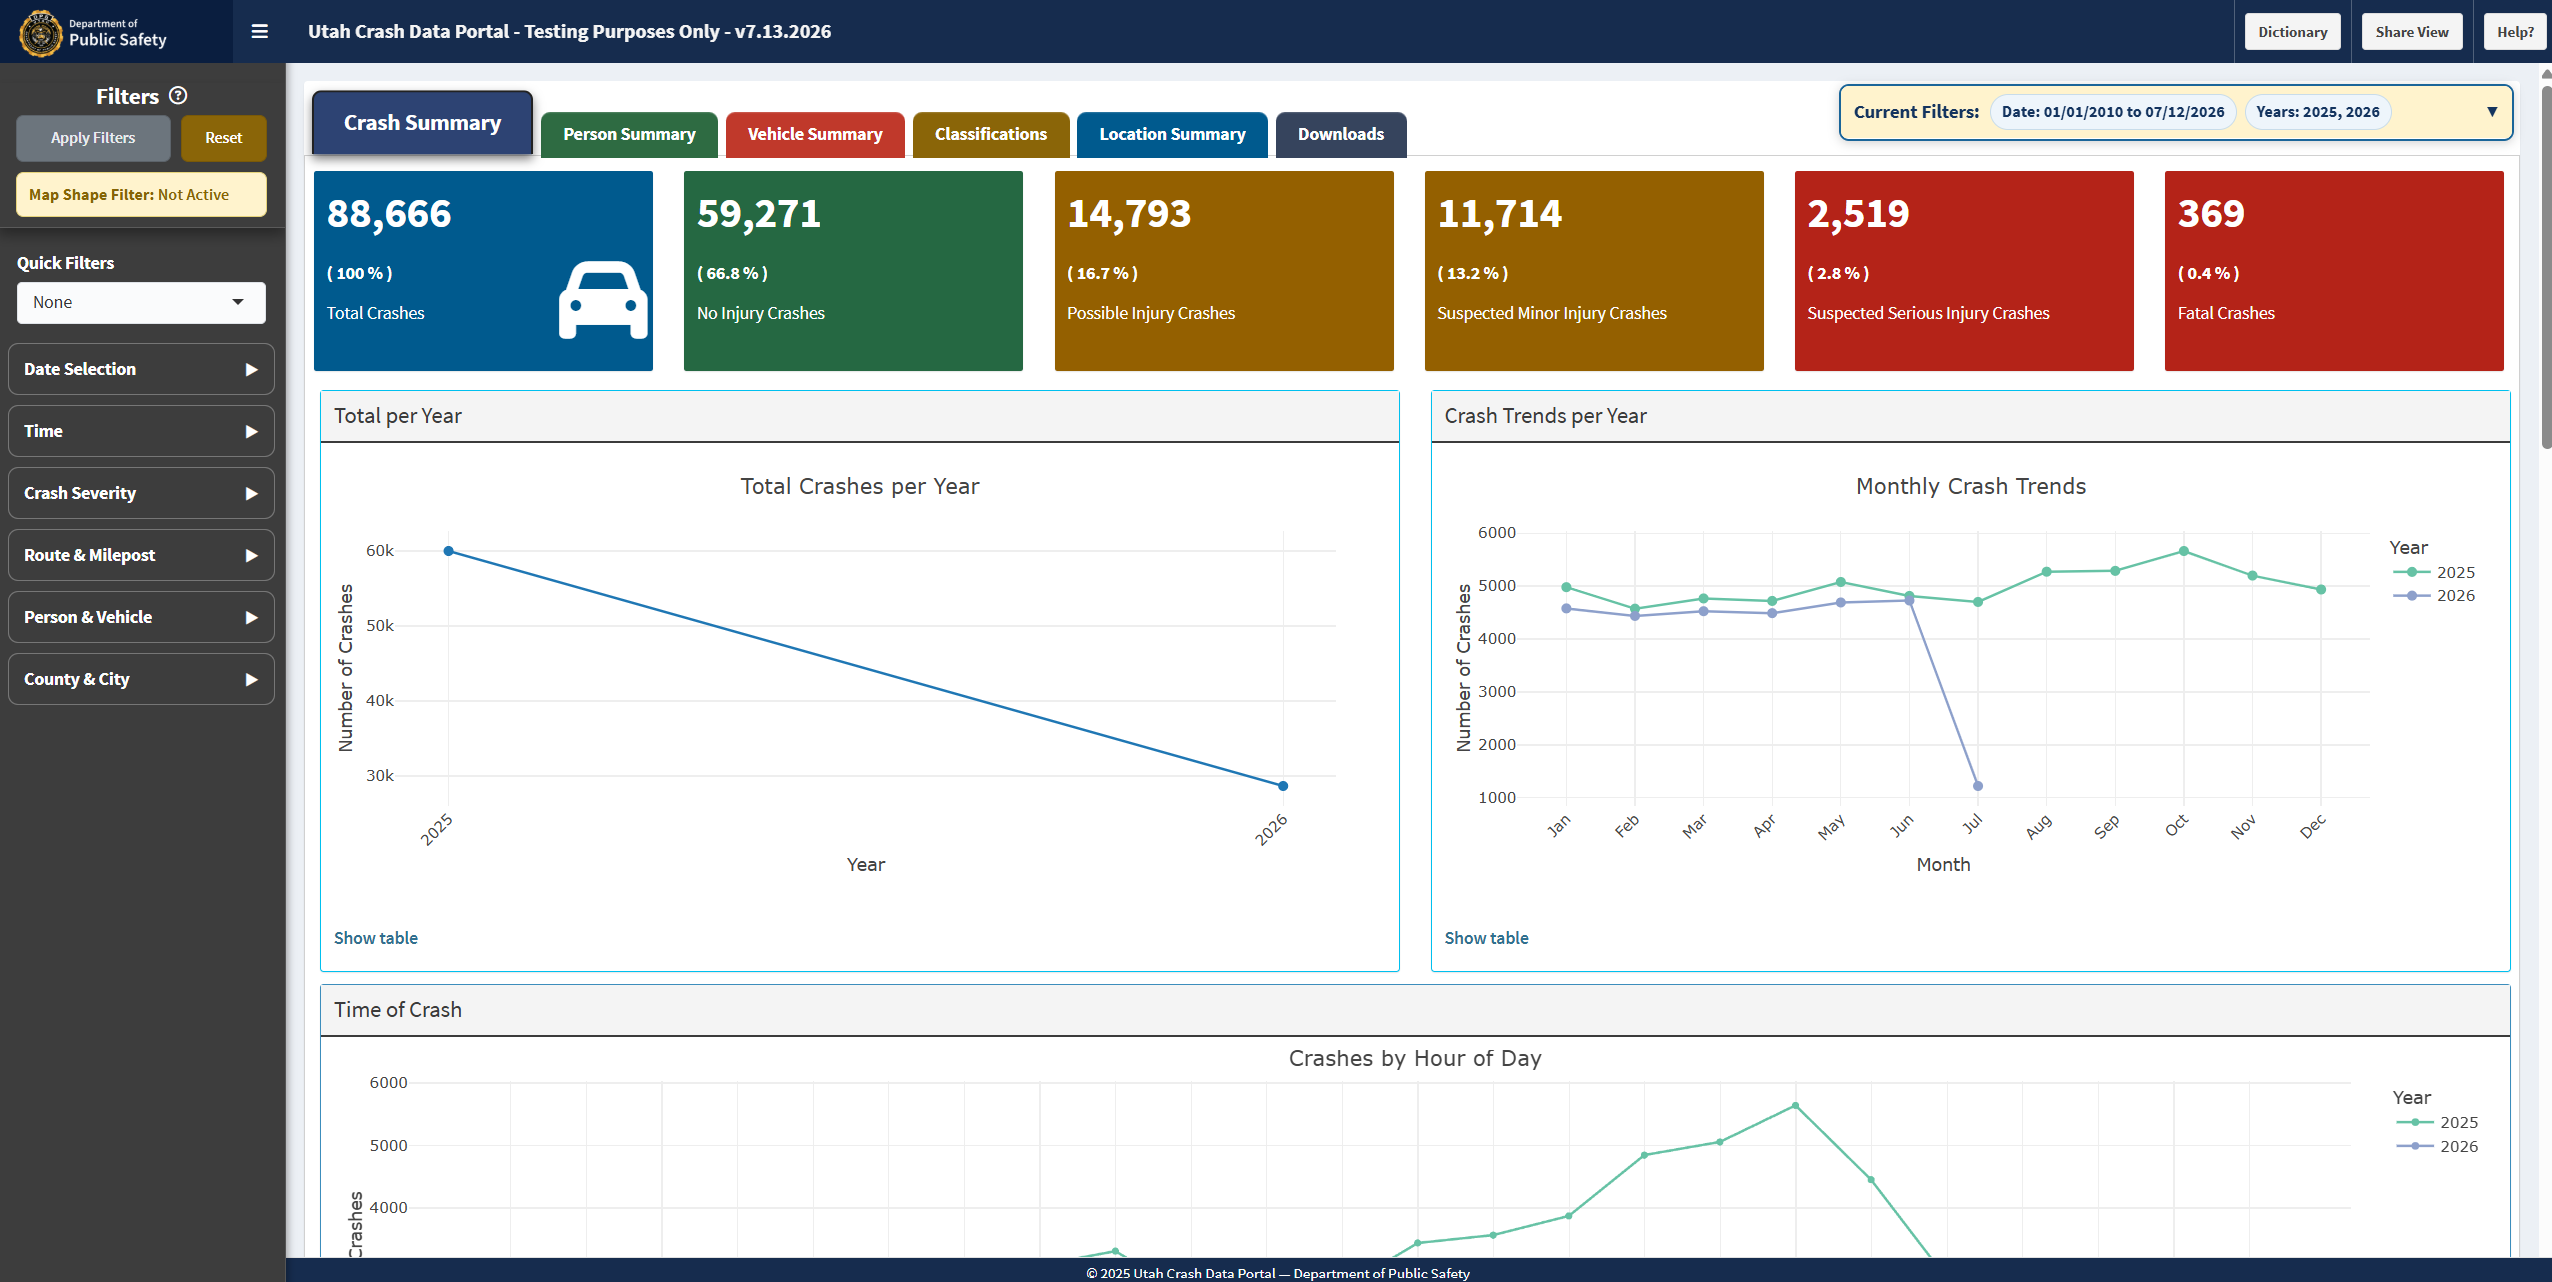
Vehicle Summary Tab
Analyze the number of vehicles involved, broad vehicle body types, and vehicle maneuvers.
↑ Back to Top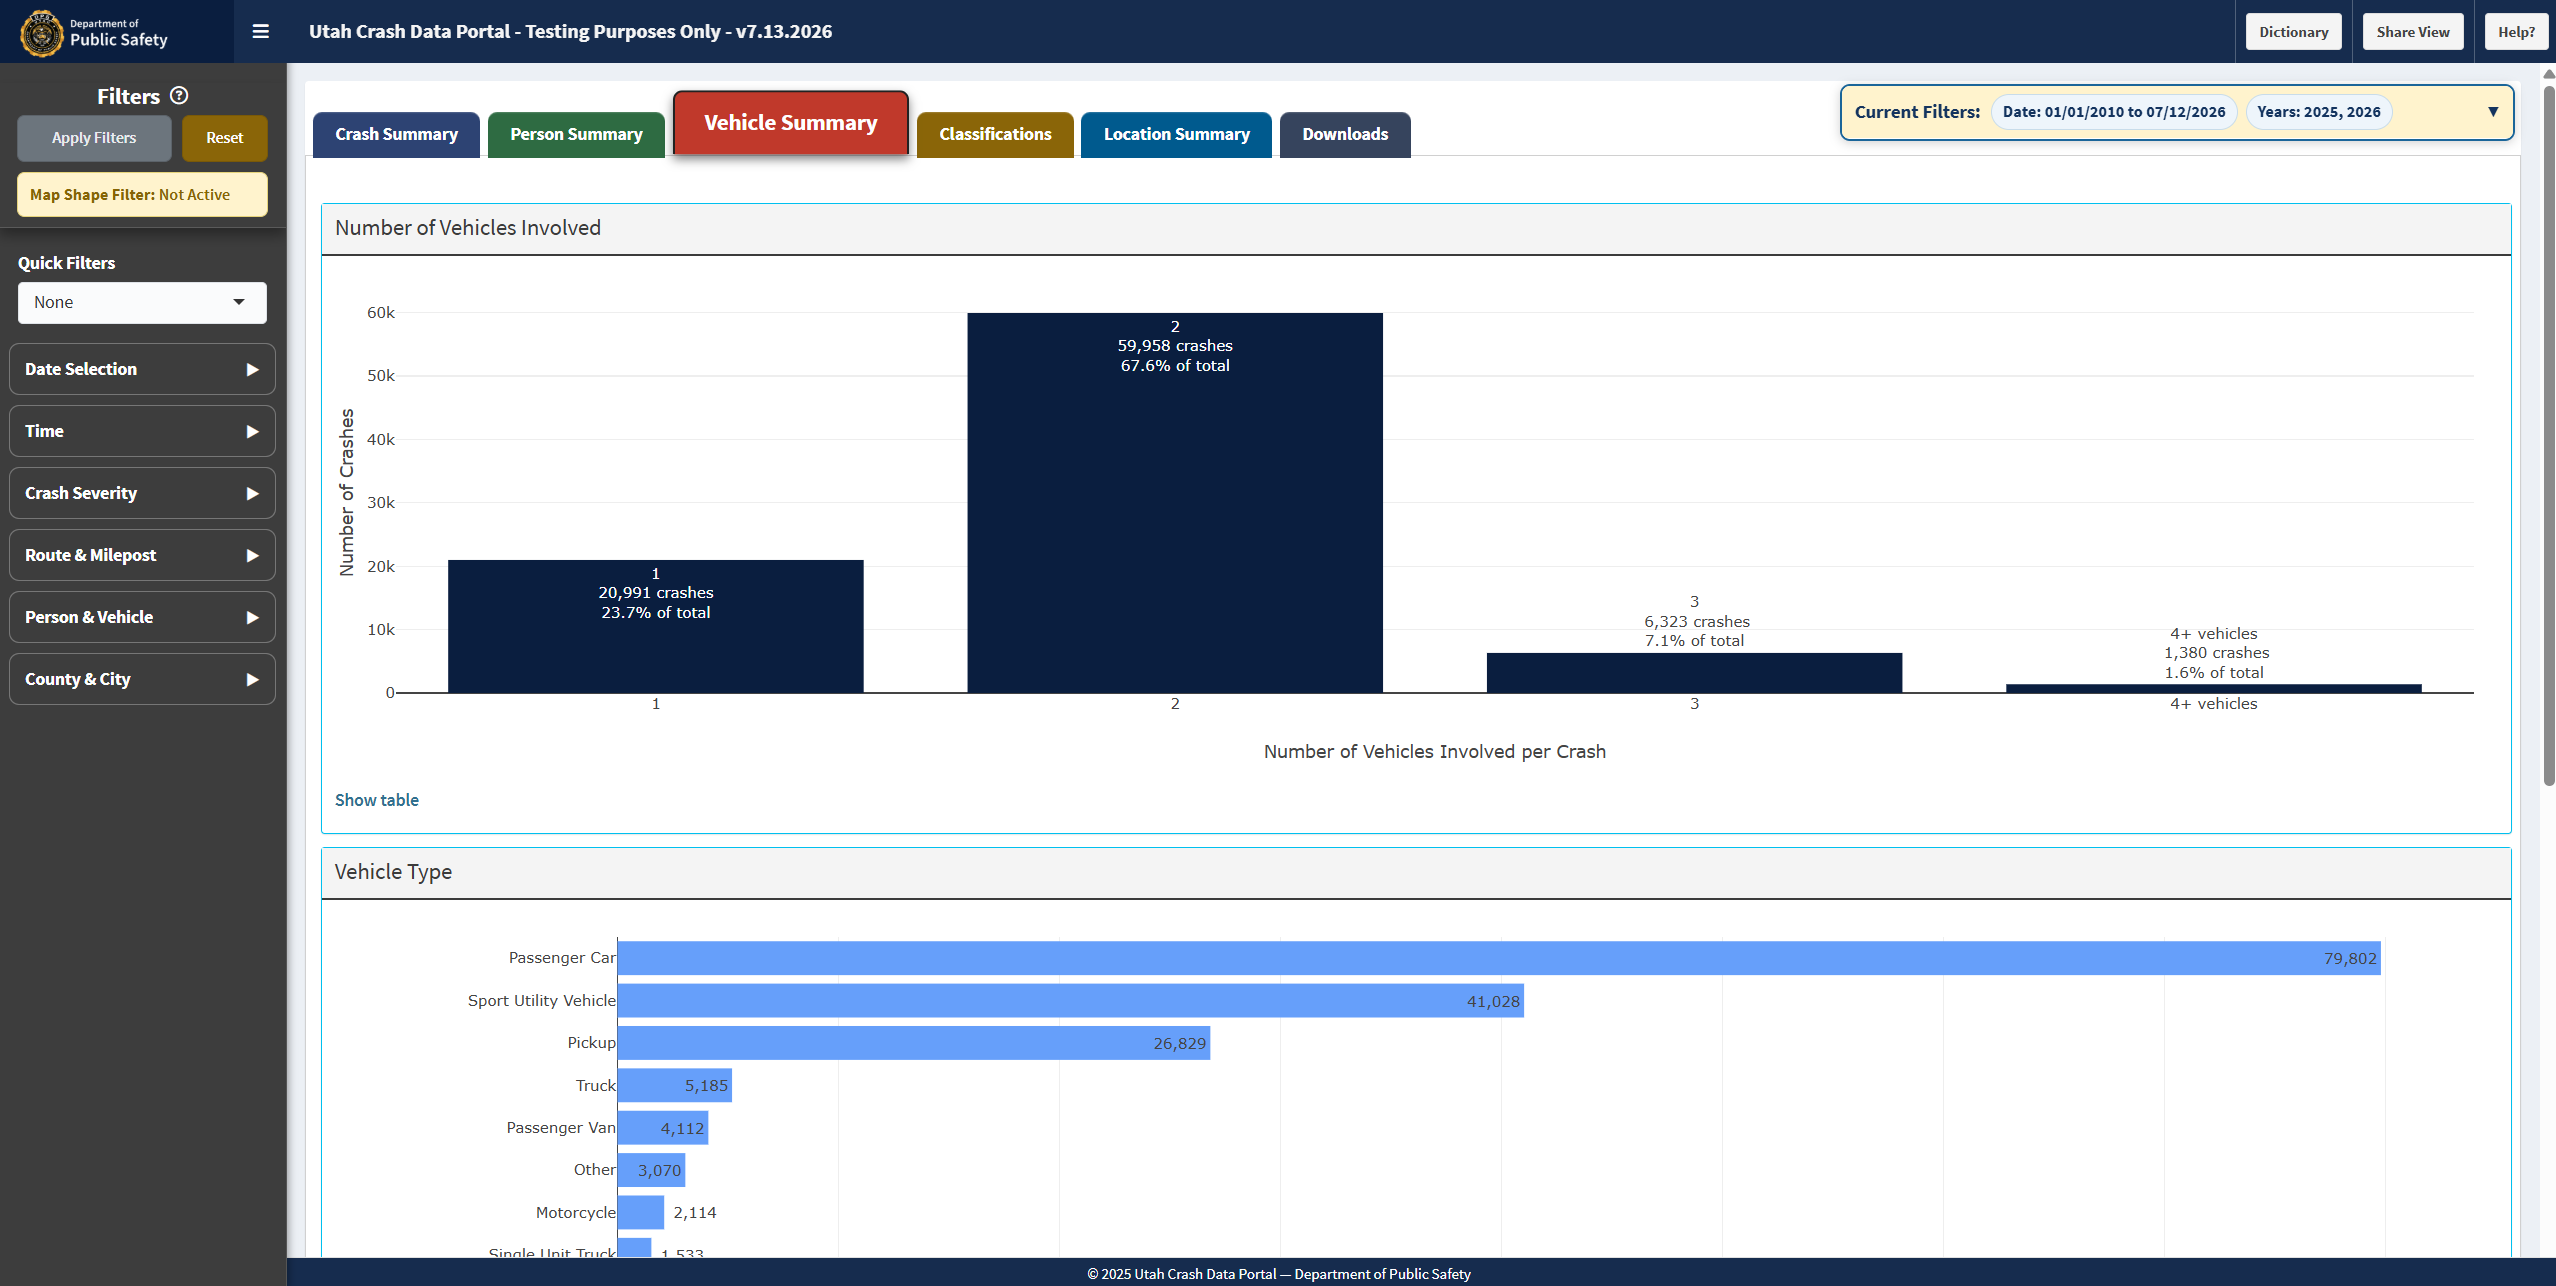
Location Summary
Explore the interactive Utah map and view top-ten county and city charts based on your filtered crash set.
↑ Back to Top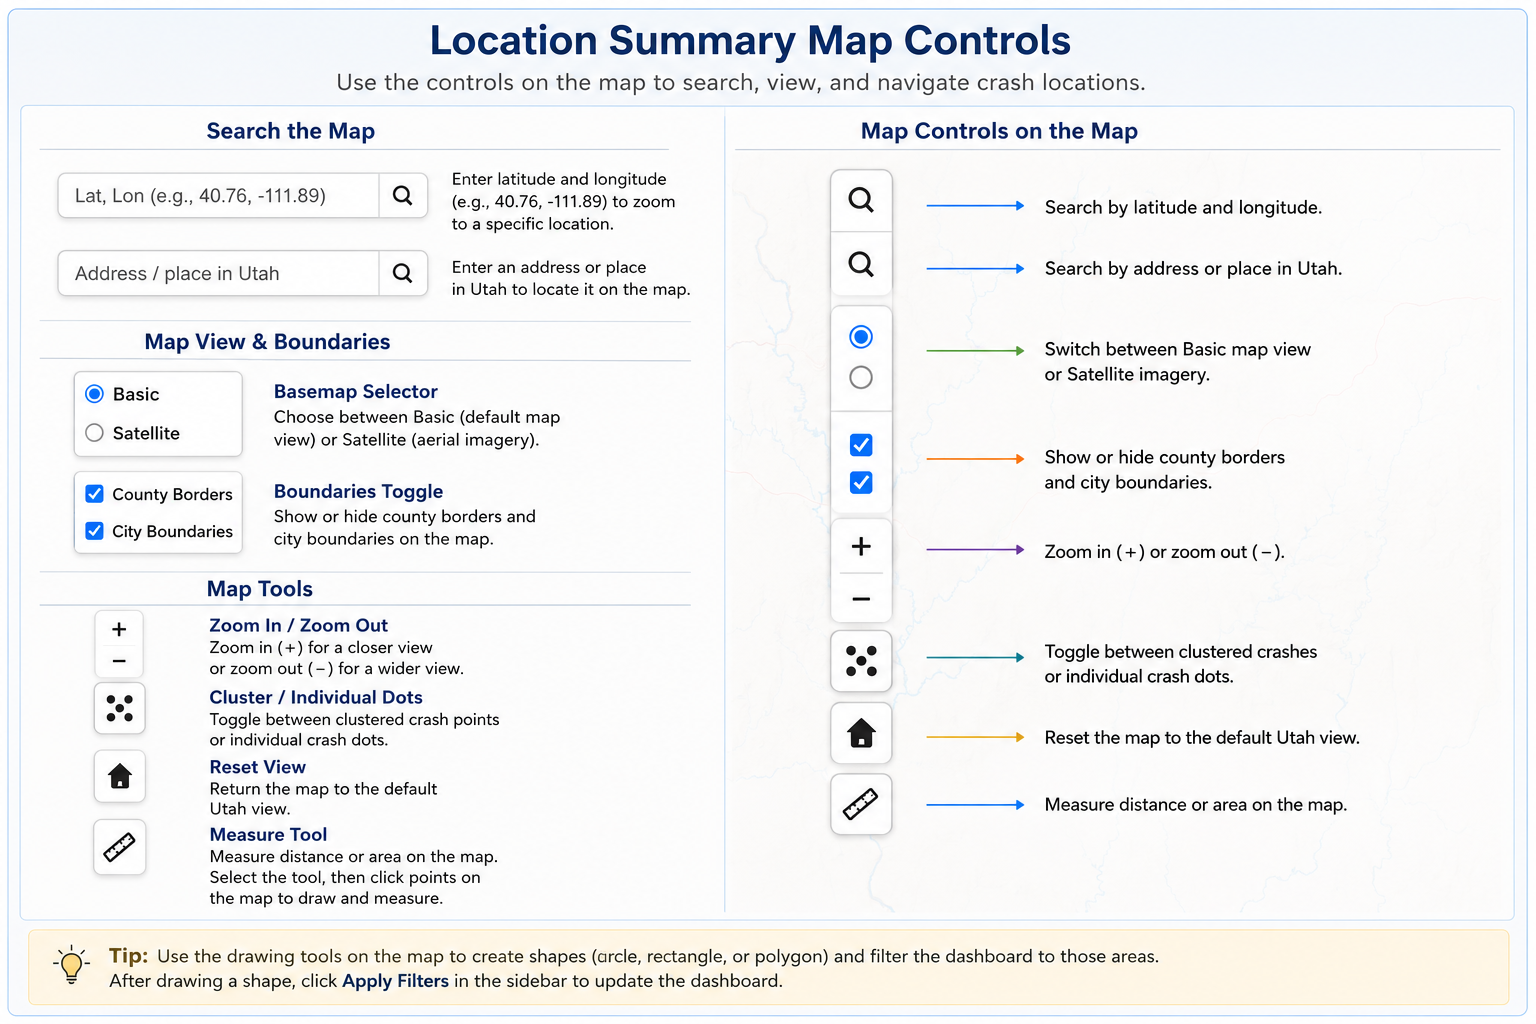
Downloads Tab
Export an Excel workbook containing the exact crash set represented by your applied filters, including tabs for crashes, persons, and vehicles.
↑ Back to Top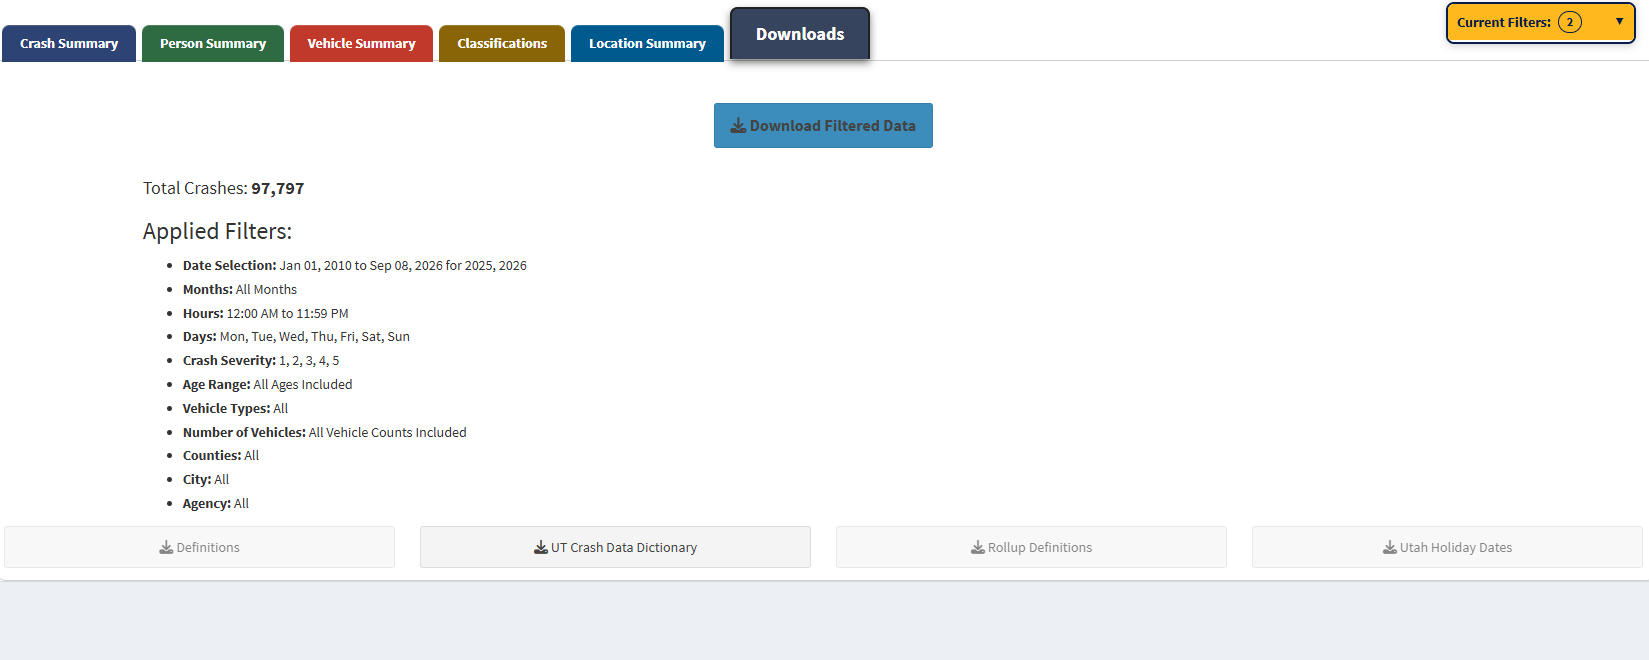
Where does the crash data come from?
- The data for the Utah Crash Summary is derived from Utah crash reports.
- Law enforcement officers throughout the state who investigate crash scenes on public roadways complete these reports.
- Information is collected when a crash involves injuries, deaths, or at least $2,500 in property damage.
- Crash reports are uploaded daily to the Utah Department of Public Safety data warehouse for central collection.
- Additional information is collected on fatal crashes at the Department of Public Safety’s Highway Safety Office and compiled into the Fatality Analysis Reporting System (FARS) database.
- FARS is a national data system that contains information on all fatal traffic crashes in the U.S.
For more information
For media inquires
Jason Mettmann
Communications Manager
801-664-7899
[email protected]
For crash data
Barbra Freeman
Traffic Records Senior Program Manager
801-783-7250
[email protected]