100 Deadly Days of Summer Data
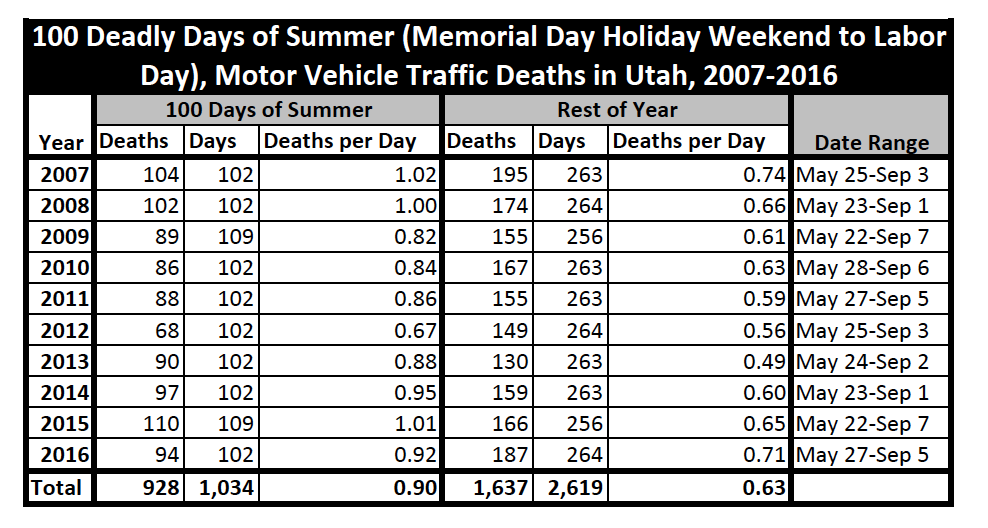
In 2016, the 100 Deadly Days of Summer experienced 0.92 motor vehicle traffic crash deaths per day compared to 0.71 deaths per day for all other days.
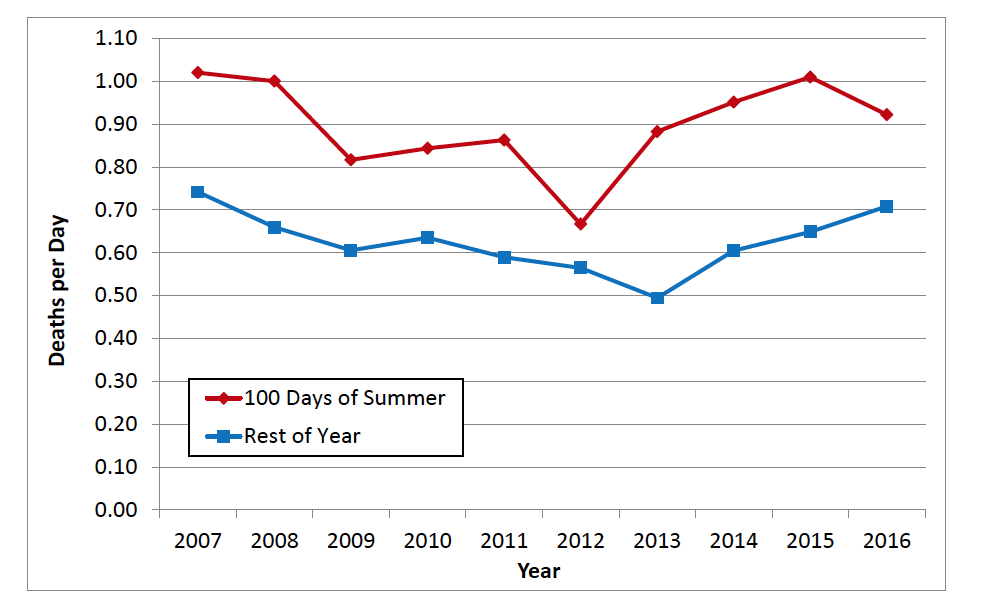
After 3 years of increasing motor vehicle traffic crash death rates per day, 2016 saw a decrease in the death rate per day over the 100 Deadly Days of Summer
Over the last 10 years in Utah, the 100 Deadly Days of Summer experienced 0.90 motor vehicle traffic crash deaths per day compared to 0.63 deaths per day for all other days.
Motor vehicle traffic crash deaths were 43% higher during the 100 Deadly Days of Summer than the rest of the year.
2007 had the highest death rate per day (1.02) and 2012 had the lowest death rate per day (0.67) for the 100 Deadly Days of Summer over the last 10 years in Utah.
If you found this news entry interesting, please consider sharing it through your social network.