2017 Utah Seat Belt Use Survey Results
88.8%
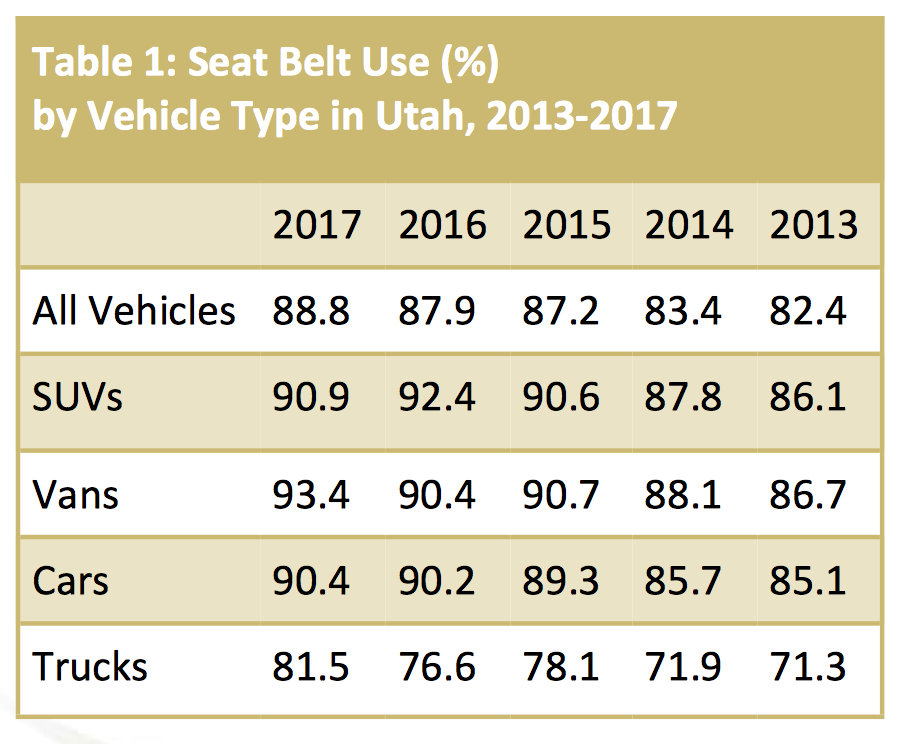
The seat belt use rate among motor vehicle occupants was 88.8% in 2017, which demonstrates an increase of 0.9% from the 2016 rate of 87.9%.
Since the implementation of the primary seat belt law in May 2015, Utah’s seat belt use has increased 5.6%.
Continued Differences
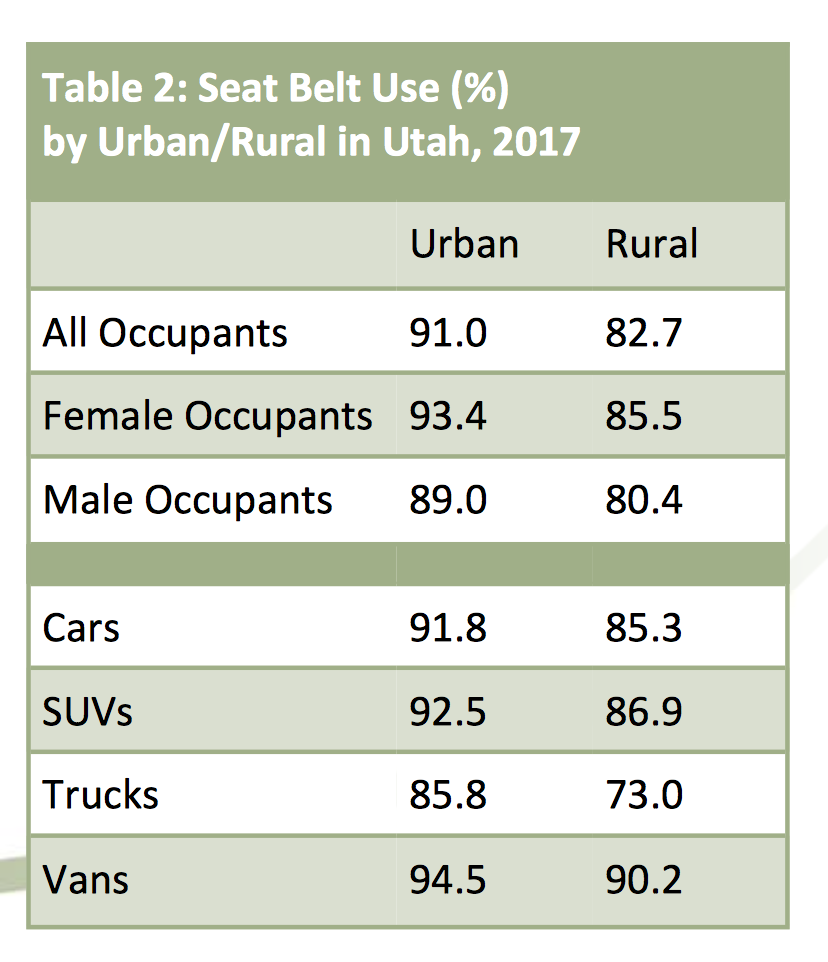
There continues to be significant differences in the rate at which males and females and urban and rural drivers buckle up.
Most/Least Likely to Buckle Up
The theoretical profiles for the individuals most and least likely to be wearing a seat belt in Utah in June 2017:
- Most likely: a female passenger in a Van, on a primary road in Davis County
- Least likely: a male driving a truck on rural roads in San Juan County
About the Survey
The National Highway Traffic Safety Administra on (NHTSA) requires states to conduct observa onal surveys annually to determine the level of seat belt use.
The 17 counties selected for observa on in Utah were: Box Elder, Cache, Carbon, Davis, Grand, Iron, Millard, Salt Lake, San Juan, Sanpete, Sevier, Summit, Tooele, Uintah, Utah, Washington, and Weber.
The study was conducted June 5-17 during which a total of 31,724 vehicle occupants, including 24,526 drivers and 7,198 outboard passengers, were observed.
Thirty-six percent (36%) of the observed vehicles were cars, 31% sport u lity vehicles (SUV), 26% trucks, and 7% were vans.
Effect of Primary Seat Belt Law
A significant change took place on May 12, 2015 with the implementa on of a primary seat belt law in Utah.
The observed usage rates increased .6% from 2012 to 2013, 1.2% from 2013-2014, 4.6% from 2014-2015, and 1% from 2016-2017.
With the other variables being equal from year to year, the logical conclusion would be that the enactment of Utah’s primary seat belt law was responsible for the significant increase in seat belt usage in 2015 – 2017.
If you found this news entry interesting, please consider sharing it through your social network.